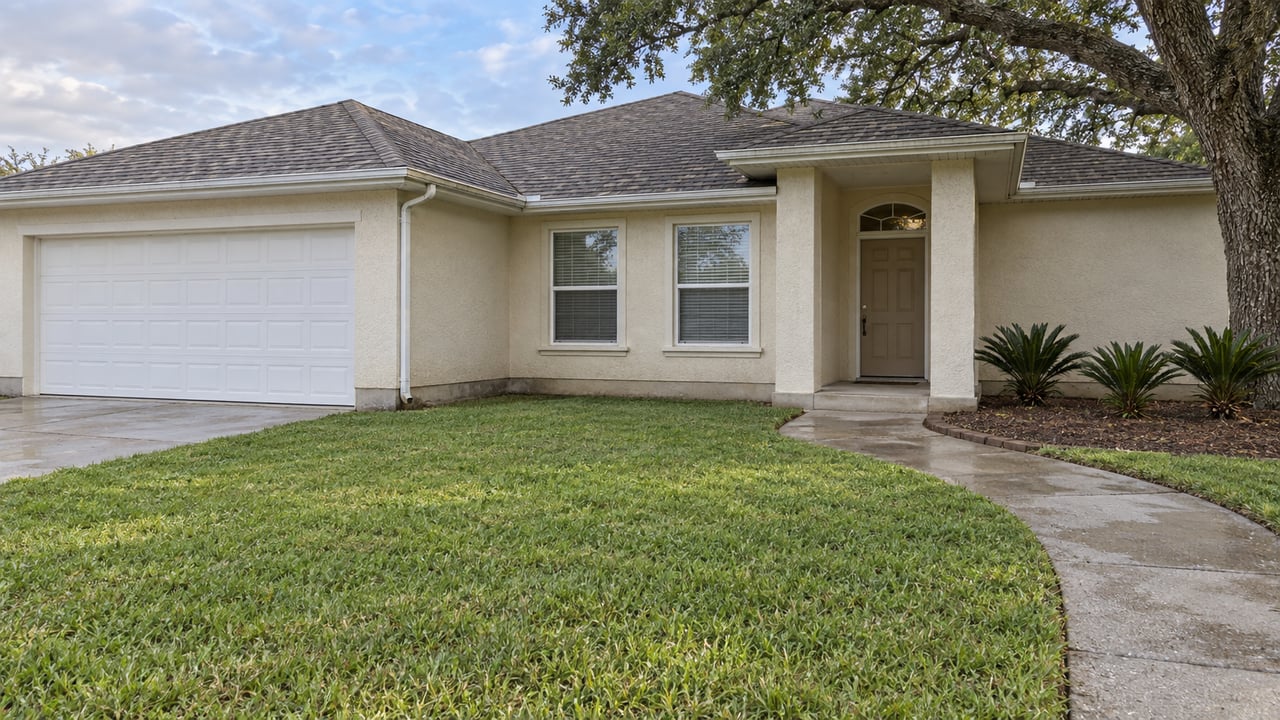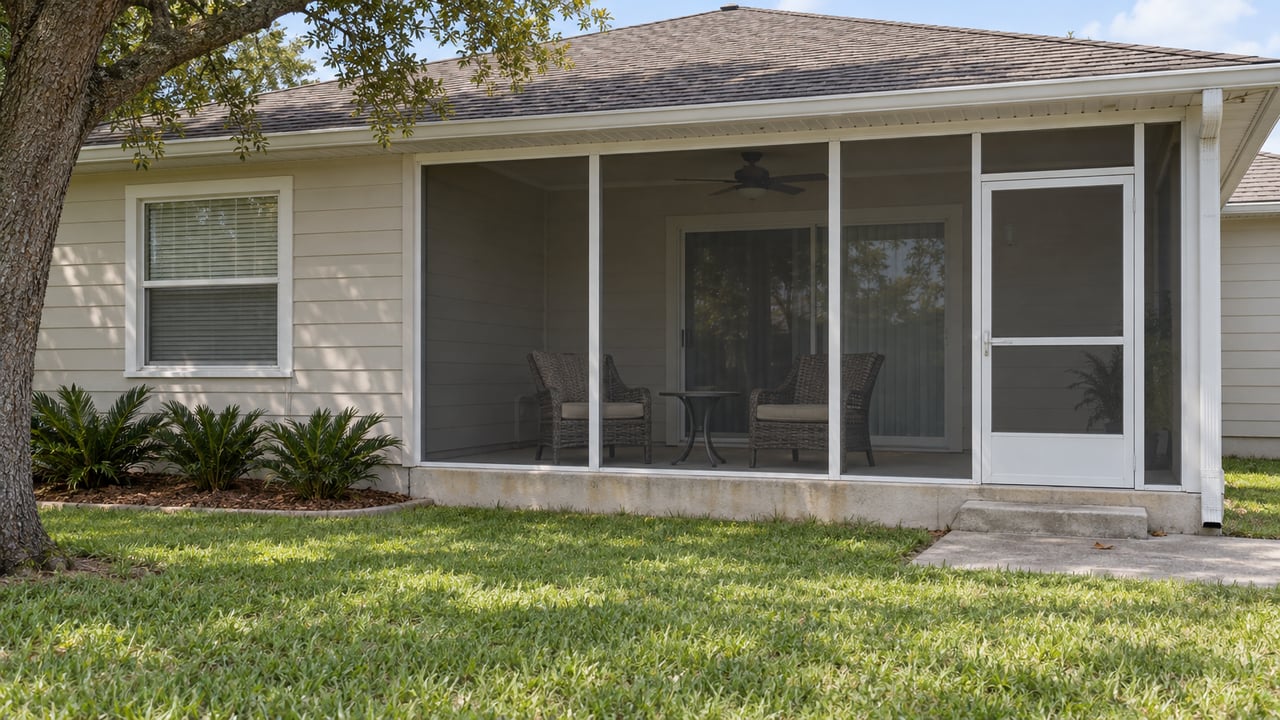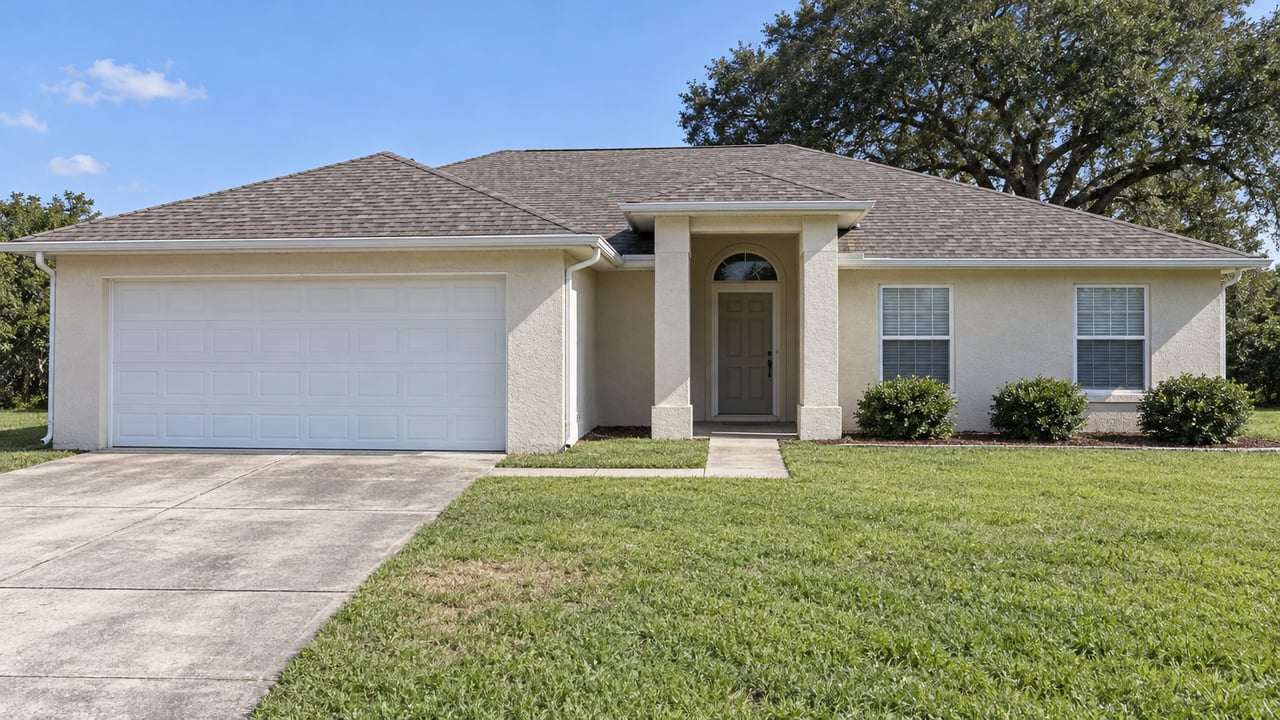
Pull up two different real estate data sources for Ormond-by-the-Sea and you will get two different answers to the same question. A market tracker's rolling 30-day snapshot, covering the period ending in late May 2026, put the median sale price at $410,000. A separate live read pulled from local MLS closings as of mid-June 2026 put it closer to $290,000. Both claim to be current. Neither is wrong. That is the part worth sitting with before anyone makes a pricing decision based on a single number pulled from a single site.
This is not a story about which source to trust. It is a story about what happens to a median when a market gets thin enough that a handful of sales can swing it in either direction, and about the numbers both sources agree on, which turn out to matter a great deal more than the one they do not.
Why the Median Keeps Moving
Ormond-by-the-Sea is a narrow, unincorporated strip on the barrier island, running along A1A (Ocean Shore Boulevard) on the ocean side and John Anderson Drive along the river side. It is mostly less than half a mile wide, which means the number of homes that can close in any given month is small by design. The 30-day tracker ending in late May 2026 counted 11 homes sold, down from 16 in the same period the year before. The mid-June 2026 live MLS read, pulling from the Daytona Beach Area Association of Realtors, based its snapshot on just 12 recent closings.
When a market trades that thin, the median is not a stable measurement. It is a reflection of whichever homes happened to close. A renovated cottage a block from the sand and an original-condition ranch three streets back from the water can carry a price gap wide enough to move the community median by tens of thousands of dollars depending on which one sold last month. That mid-June 2026 analysis of current listings found updated homes in the area asking roughly 114 percent more per square foot than original-condition homes, and selling faster. That gap alone explains why the median jumps around: it is not tracking appreciation, it is tracking which end of the condition spectrum happened to transact in a given window.
What Both Sources Actually Agree On
Strip out the median and look at everything else, and the picture stops being noisy. Both reads on Ormond-by-the-Sea's recent activity point the same direction on the numbers that matter more for a real transaction.
Days on market has stretched out. The 30-day tracker ending in late May 2026 showed homes taking a median of 72 days to sell, up from 45 in the same period a year before. The mid-June 2026 live MLS snapshot put the average even higher, at 225 days. The exact figure differs by methodology and by which window each source measures, but the direction is the same either way: homes are sitting substantially longer than they were selling a year ago.
Supply is tightening at the same time demand appears to be slowing, which is its own kind of signal. In that same 30-day window ending in late May 2026, active inventory was down 22.2 percent year over year, and new listings coming to market were down 25 percent. Sellers are not flooding the strip with new product, and the sale-to-list price ratio slipped to 92.66 percent, down 1.6 points from the year before. Nearly 45 percent of active listings had taken at least one price cut, up 8 points from the prior year.
Put together, that is a market where fewer new sellers are testing the water, the ones already listed are cutting price at an elevated rate, and the homes that do sell are taking well longer to get there than they were twelve months earlier, by either source's clock. That is a very different story than "median price is up," even though both statements describe the same stretch of activity.
The Infrastructure Backdrop Nobody's Pricing In Yet
There is a wrinkle worth understanding here, because it cuts against the easy assumption that a slower market means declining confidence in the location itself. The barrier island has just come through a significant resilience upgrade. The Florida Department of Transportation's buried secant seawall along a roughly 1.3-mile stretch of A1A between Sunrise Avenue and Marlin Drive, the exact segment that runs through Ormond-by-the-Sea, was substantially finished in late 2025 with the remaining landscaping and dune walkover work wrapping in early 2026. As News 13 reported, Phyllis Walter, president of the Madeira Villa South Condominium Association, whose building sits along that stretch, said at the outset of construction she hoped to see “our big, beautiful beach again and our safe road.”
That project is separate from a newer one just announced. Volusia County commissioners have moved forward with a 5.5-mile beach and dune restoration project along the coast, funded through a mix of FDOT agreements, FEMA disaster recovery money, and local beach management funds, budgeted at just over $35 million. Construction is expected to begin in November 2026 and run four to six months.
So the physical protection on this stretch of coastline is arguably at its strongest point in years, right as the transaction data shows the softest activity in recent memory. That is not a contradiction that resolves itself easily, and it is exactly the kind of detail worth knowing before assuming a slow market means declining appeal. It may simply mean the market has not caught up yet to what just got built underneath it.
What This Means If You Are Actually Comparing These Two Areas
If you are a buyer weighing Ormond-by-the-Sea against the mainland, the headline median is close to useless on its own. What matters is that homes here are sitting long enough, and price cuts are common enough, that a prepared buyer has genuine room to negotiate, even on a listing whose asking price looks aggressive next to last year's numbers. Ask for the specific comp inside the community, not the community-wide average, before deciding what a fair offer looks like.
If you are a seller, price off the closest same-exposure sale rather than any single site's median. A listing priced to a six-month-old community average, in a market where the newest reads show days on market stretching past two hundred, is a listing that risks becoming one of the 45 percent taking a price cut rather than one of the ones that close on schedule.
FAQ
Why do different real estate sites show such different numbers for the same area? Each site pulls from a different data window and a different set of closed sales. In a thinly traded market like Ormond-by-the-Sea, where only a handful of homes close each month, whichever few sales happen to fall inside that window can shift the median significantly.
Does the completed seawall project change anything for insurance or financing? The project was designed specifically to protect the A1A corridor and the properties along it from the kind of erosion and road damage seen in past storms. Any specific effect on an individual property's insurance rate or financing terms would depend on that property's elevation, flood zone, and construction, so it is worth confirming with a lender and insurer directly rather than assuming a blanket change.
If you are weighing a purchase or a listing on this stretch of the barrier island and want a read on what a specific block or building is actually doing right now, rather than what a national aggregator's trailing average says, reach out to Michael Fiscina to schedule a free consultation.
This article is general information, not legal, tax or financial advice. Consult a qualified professional about your situation.